Bank statement PDF or scan
Bank statements
One row per transaction with dates, descriptions, amounts and balances.

These are the real formatting and workflow issues teams usually run into.
One metric may appear across the income statement, balance sheet, cash flow statement, and notes, sometimes with different units.
Long reports contain repeated headers, merged cells, and tables that continue across pages, increasing the risk of year-column shifts.
Analysts need to know the source of every number and distinguish reported values from conversions or manual adjustments.
The goal is not just conversion. The goal is structured output your team can use immediately.
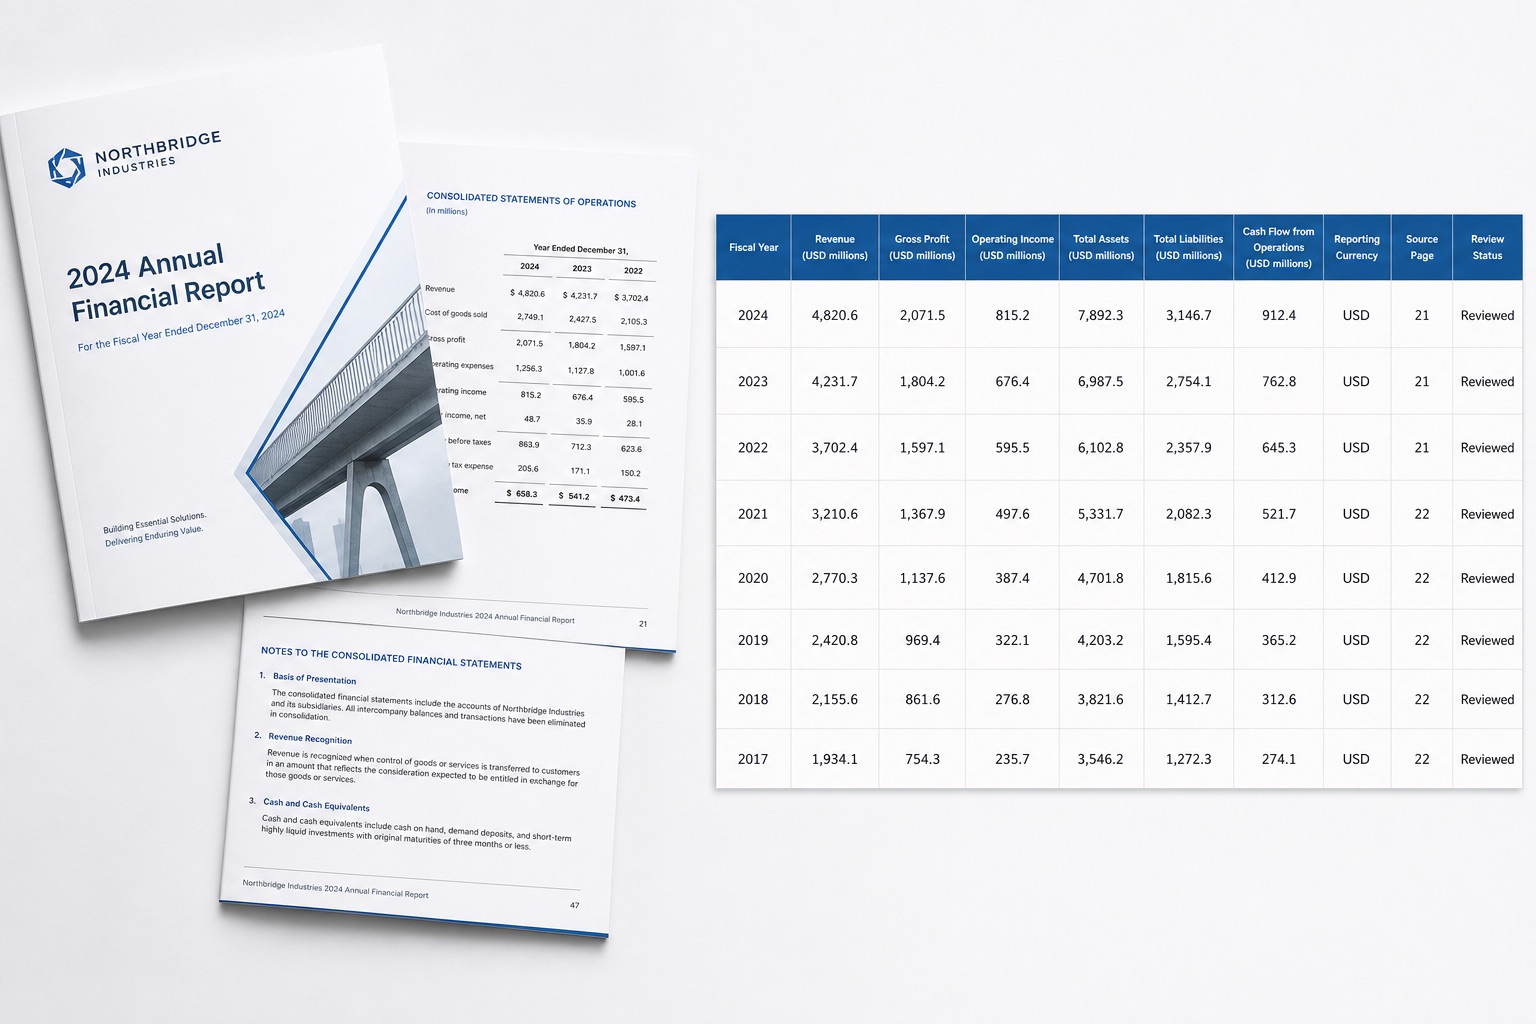
Extract selected metrics such as revenue, gross profit, operating income, assets, liabilities, and operating cash flow instead of copying every table.
Keep fiscal year, reporting currency, unit, and source page in separate columns to make comparison assumptions visible.
Preserve year alignment across repeated headers and multi-page statements, while sending missing or ambiguous values to review.
Use the result for analysis preparation, not as an audit opinion, investment recommendation, or certified financial statement.
Best when the source layout is inconsistent and the target output needs to follow business logic.
The point is not to mirror the source page. It is to create an output file that saves follow-up work.
A practical three-step path from source file to usable Excel output.
Upload the annual or financial report PDF and define the metrics, years, currency, and units required.
Extract values from statements and relevant notes while keeping source pages and basis questions visible.
Review years, units, signs, and totals, then export Excel for analysis or data archiving.
Yes. A focused field list is usually clearer and easier to review than converting every table in the report.
Results can be organized by metric and year with source pages retained. Units, years, and totals should still be checked after export.
No. It is structured data preparation. Material figures must be checked against the published report by a qualified reviewer.
If you copy annual report metrics by hand, test several reports from one industry to calibrate metric definitions and source-page review.